Graphs, Continued
Pie charts
Pie charts are another way of illustrating a percentage breakdown. Pie charts
work well with information that is simple and has few divisions. To plot a
pie chart, you should know angular measurement and how to use a
protractor.
Angular
measurement
A pie chart is based on a 360-degree circle. Three hundred sixty degrees
represents 100 percent. You should have solid information on the percentage
value that the segments of the pie represent. Multiply the percentages
individually by 3.6 to find the degree of angle to plot with the protractor on
the pie. When you add up the plotted segments, you should have 100
percent. The formula for determining angular measurement on a pie chart is
to take the given percentage and multiply by 3.6.
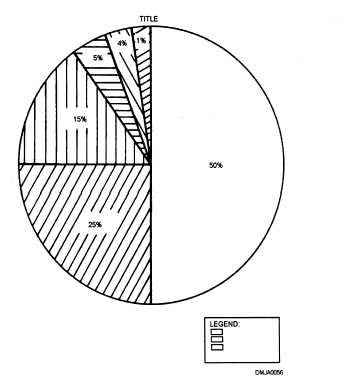
Figure 2-18 shows a completed pie chart.
Figure 2-18. —A pie chart.
2-25