Graphs, Continued
Percentage bar
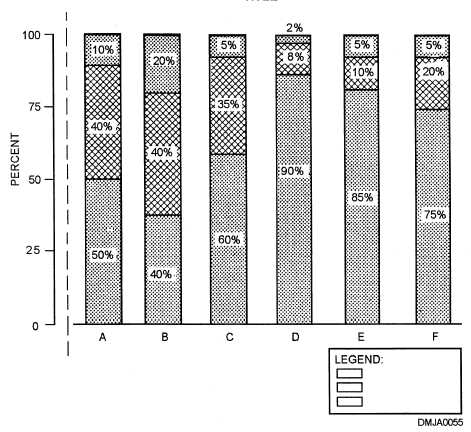
There are two graphs you may use to represent percentage breakdowns,
graphs
percentage bar graphs and pie charts. Construct a percentage bar graph as
you would a bar chart. However, each parallel bar extends full measure up
the y-axis and has a sum total of 100 percent. Divide the parallel bar into
percentages and indicate these figures within the section to which they
pertain. To further clarify quantities, add color or shading to the various
segments within the bar.
Figure 2-17 shows a percentage bar graph.
Figure 2-17. —A percentage bar graph.
Continued on next page
2-24

