Graphs, Continued
Bar graphs
A bar graph shows, by varying lengths of parallel lines, comparisons or
trends in quantitative measure. Plot constant values along the x-axis and
dependant or variable values along the y-axis. Providing the information is
kept simple and a legend defines the bar representation, you can display more
than one set of figures on a bar graph.
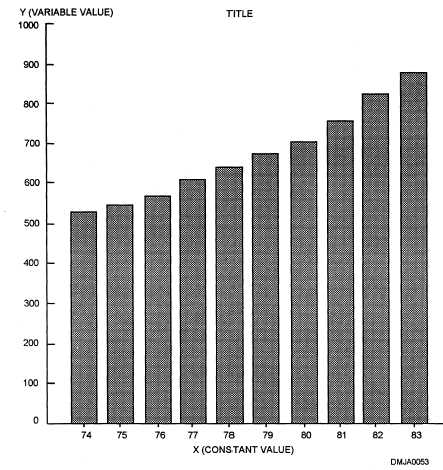
Figure 2-15 shows a simple bar graph.
Figure 2-15. —A bar graph.
Continued on next page
2-21

