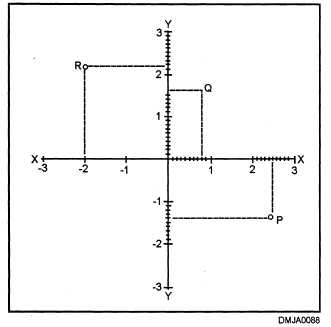
IN ANSWERING QUESTIONS 2-55 THROUGH 2-57,
REFER TO FIGURE 2A.
Figure 2A.
4-55.
Which of the following coordinates
represents point R?
1.
( - 2 , - 2 . 2 )
2.
( - 2 , 2 . 2 )
3.
( 2 . 2 , - 2 )
4.
( - 2 . 2 , - 2 )
2-56.
Which of the following values
assigned to the x and y coordinates
locates point Q?
2-57.
What are the values of coordinates
3.
x = .8, y = 1.6
4.
x = - . 8 , y = - 1 . 6
1.
2.
x = 1.6,
y =
- 1 . 4
x = - . 8 , y = 1.6
x and y for point P?
1.
x = 2 . 5 , y = - 1 . 4
2.
x = - 2 . 5 , y = 1.4
3.
x = - 1 . 4 , y = - 2 . 5
4 .
x = - 2 . 5 , y = - 1 . 4
2-58.
T o i l l u s t r a t e s u c h t h i n g s a s
comparative costs and quantity,
what type of graph should you
chose?
1.
Rectangular coordinate graph
2.
Percentage chart
3.
Bar graph
4.
P i e c h a r t
2-59.
When constructing a bar graph, what
s t e p s h o u l d y o u t a k e f i r s t ?
1.
D e t e r m i n e t h e s c a l e
2.
S e l e c t t h e p a g e s i z e
3.
Determine the reference frame
4.
Determine the length of the
b a r s
2-60.
After you determine the reference
frame for a bar graph, what should
be your next step?
1.
P l o t v a l u e s
2.
S e l e c t t h e p a p e r s i z e
3.
F i n d a s u i t a b l e s c a l e
4.
Choose appropriate axes
2-61.
When a bar graph is drawn on the
r i g h t s i d e o f a s h e e t o f p a p e r , f o r
what are the margins at the sides
of the sheet used?
1.
D i s t a n c e s c a l e s
2.
Additional bars
3.
T h e t i t l e o f t h e g r a p h
4.
Explanatory notes and figures
2-62.
When selecting a scale for the y-
a x i s o f a b a r g r a p h , w h a t a c t i o n
should you take before plotting the
values?
1.
U s e a n e n g i n e e r ' s s c a l e
2.
F i n d t h e l a r g e s t v a l u e s t o b e
p l o t t e d
3.
Add additional values to the
l a r g e s t v a l u e
4.
All of the above
13


